


TL;DR
Review PostHog pricing, live status signals, and GitHub activity before choosing it for product analytics, replay, flags, or data pipelines.
PostHog is an open-source product analytics platform for teams that want product analytics, session replay, feature flags, experiments, surveys, and data warehouse workflows in one stack. The short version: PostHog is strongest when a product or engineering team wants developer-friendly analytics and is comfortable checking usage-based pricing by product before committing large event volumes.
This review covers the three searches that usually happen before a team adopts PostHog:
- PostHog pricing and what the free tier actually means
- PostHog status and how to read reliability signals
- PostHog GitHub activity and what open-source momentum shows
PostHog Pricing: The Fast Answer
PostHog uses usage-based pricing with generous free allowances. The official pricing page positions the model around a free tier, pay-as-you-go usage after free allowances, and enterprise contracts for larger teams that need stricter controls.
For a buyer, the practical question is not "Is PostHog free?" It is "Which PostHog products will we use, and what happens when our event, replay, flag, or warehouse volume grows?"
What Is Included Free
PostHog's pricing page highlights free usage for core products such as product analytics, session replay, feature flags, and related tools. The page repeatedly references a free allowance of 1 million units for some usage categories, but each product has its own meter and billing behavior.
That means a small startup can often start without a bill, but a production team should still model traffic by product:
- Product analytics events
- Session recordings
- Feature flag requests
- Survey and experiment usage
- Data warehouse syncs or destinations
- Retention needs for historical analysis
If your app sends millions of backend events, the product analytics line can matter most. If your team records many sessions, replay storage and replay volume can become the real driver. If feature flags run on every request or every page load, flag evaluation volume deserves its own estimate.
Pay-As-You-Go Pricing
PostHog is useful for teams that dislike seat-based analytics pricing. Unlimited or broad team access can be easier to reason about than charging every product manager, engineer, or founder who needs dashboard access.
The tradeoff is that usage-based pricing needs owner discipline. Before rolling PostHog into every service, define which events are product signals and which are noisy telemetry. Track server-side events, frontend page views, and replay capture rates separately. Then review PostHog billing after the first real traffic cycle instead of waiting until the end of a quarter.
Enterprise Pricing
Enterprise plans are for teams that need procurement, security controls, custom terms, higher support expectations, or more formal data governance. If you need SSO, audit controls, custom retention, or a negotiated contract, treat the pricing page as a starting point and talk to PostHog sales.
PostHog Status: What To Check
PostHog runs a public status page at status.posthog.com. Check it before migration, before incident retrospectives, and when analytics dashboards look wrong.
The useful parts of the status page are:
- US Cloud and EU Cloud component health
- Event ingestion success
- Event ingestion lag
- Session replay ingestion
- Feature Flags API
- REST API query endpoints
- Data warehouse source ingestion
- Recent incidents and updates
As of June 30, 2026, the status page showed most core US and EU Cloud components as operational, but Data Warehouse Source Ingestion was marked as degraded for both regions because of data warehouse sync delays. That is a good example of why status should be read by component, not as a single overall yes/no signal.
If your team depends on PostHog for user-facing feature flags, check the Feature Flags API component. If you depend on analysis after the fact, event ingestion lag and query endpoints matter more. If PostHog feeds your warehouse, data warehouse source ingestion is the component to watch.
GitHub Activity: Is PostHog Still Active?
PostHog's main repository is github.com/PostHog/posthog. On June 30, 2026, the GitHub API reported:
- 35,233 stars
- 2,904 forks
- 396 contributors
- Repository activity updated on June 30, 2026
- Latest release returned by GitHub API:
posthog-cli/v0.7.33, published June 25, 2026
Those numbers do not prove product quality by themselves, but they do show that PostHog is not an abandoned open-source analytics project. A buyer should still inspect the issue backlog, release notes, and the exact product area they plan to use. Activity in a large monorepo can be broad while a specific feature has a different maintenance pace.
When PostHog Is A Good Fit
PostHog is a strong fit when your team wants product analytics close to engineering work. It is especially useful when the same team wants to combine event tracking, session replay, feature flags, experiments, and surveys without stitching together several separate vendors.
Choose PostHog when:
- Engineers will help own analytics instrumentation
- You want open-source visibility into the platform
- You need product analytics and feature flags in the same workflow
- You want replay and funnel analysis tied to real user events
- You can manage event volume intentionally
- You are comfortable reading usage-based billing by product
PostHog may be less comfortable when a non-technical marketing team wants a purely visual analytics tool, or when procurement requires predictable fixed pricing before traffic patterns are known.
What To Review Before Adopting PostHog
Use this checklist before moving production analytics into PostHog:
-
Map your event taxonomy. Decide which events are useful product signals and which are only debug noise.
-
Estimate monthly volume. Count frontend events, backend events, session recordings, and flag evaluations separately.
-
Decide retention needs. Longer lookback windows can change the value of paid plans and warehouse exports.
-
Check the status page by component. Do not treat "mostly operational" as enough if your use case depends on one degraded component.
-
Review GitHub for your feature area. Look at recent commits, open issues, and releases related to the products you plan to use.
-
Test data export paths. If PostHog will feed BigQuery, Snowflake, S3, or another warehouse, validate that path early.
How To Estimate PostHog Cost Before Launch
The safest way to estimate PostHog cost is to build a simple usage model before the SDK goes live. Start with the product areas you plan to enable, then assign a monthly estimate to each one. A rough model is better than guessing from page views alone because PostHog products are not all metered the same way.
For product analytics, count the events your app will actually send. A page view, signup step, checkout step, API job, and background process can all become separate events if instrumentation is too broad. For session replay, estimate how many sessions you will record and whether you will sample only part of traffic. For feature flags, estimate evaluations from both frontend and backend SDKs. For warehouse syncs, include how many sources and destinations need to run daily.
Then decide which events are worth keeping. A smaller event taxonomy usually produces cleaner dashboards, lower billing risk, and less confusion for product teams. The best PostHog setup is not the one that captures everything. It is the one that captures the few behaviors your team will actually review every week.
How ScrapeGraphAI Uses PostHog
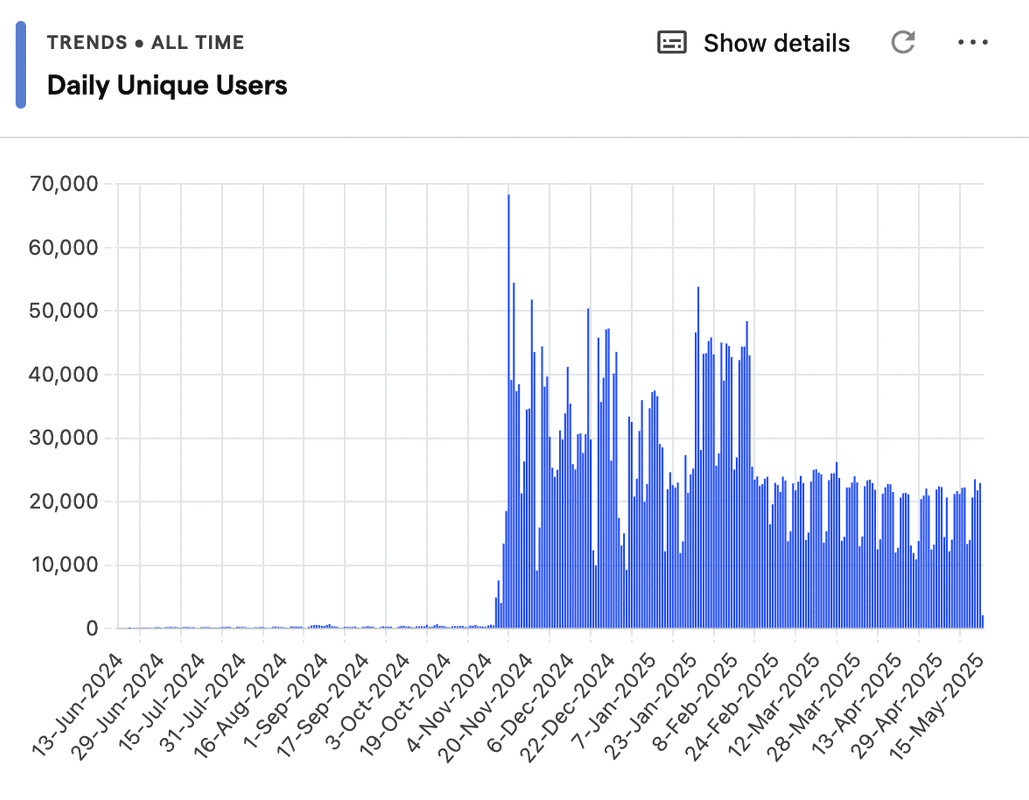
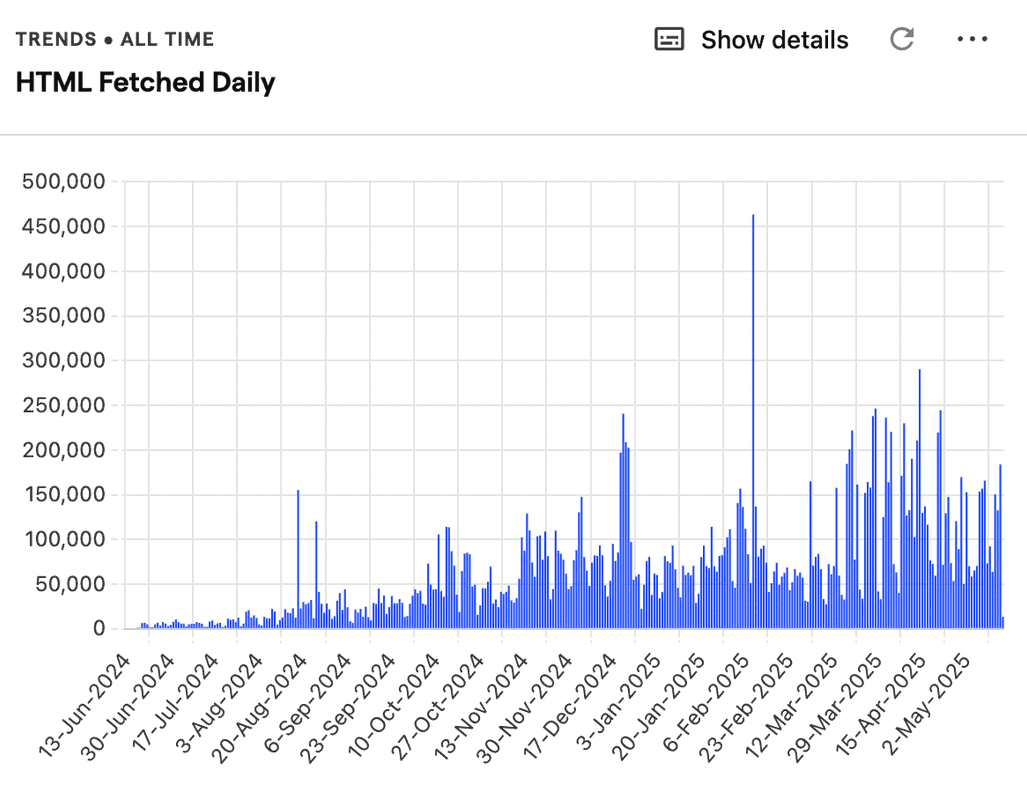
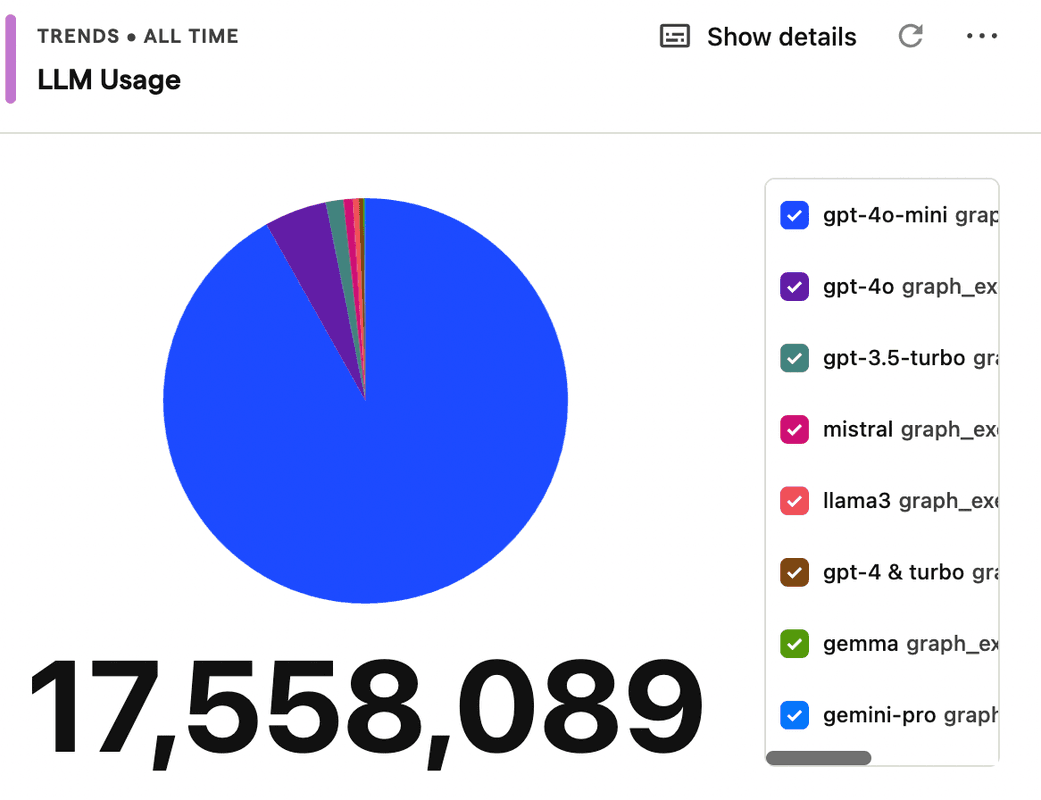
At ScrapeGraphAI, PostHog helps us understand how people interact with the product and where the scraping workflow needs work. We use it as a product analytics layer, not as a replacement for infrastructure monitoring.
The most useful PostHog views for us are:
- Product usage dashboards for onboarding and activation
- Event trends for scraping job volume and feature adoption
- Funnel views for setup and configuration steps
- Replay and behavior signals when a workflow is confusing
- Internal charts for LLM usage, graph execution, and latency patterns
That separation matters. Product analytics explains what users do. Logs, traces, API metrics, and Sentry explain why systems fail. PostHog is valuable when it sits beside those tools instead of pretending to replace them.
PostHog Pricing FAQ
Is PostHog free? PostHog has free allowances for several products, but production teams should model usage by event, replay, feature flag, and warehouse volume.
Is PostHog open source? Yes. The main PostHog repository is public on GitHub and had more than 35,000 stars on June 30, 2026.
Where can I check PostHog uptime? Use status.posthog.com and check the specific component your product depends on.
Does PostHog replace application monitoring? No. PostHog is best treated as product analytics. Keep logs, traces, error tracking, and API metrics for operational debugging.
Should startups use PostHog? PostHog can be a good startup analytics choice when engineering owns instrumentation and event volume is kept intentional from the beginning.